

Commercial fishing is a large part of the economy in Washington state. Various gear types and are used throughout Washington waters and are largely managed by the Department of Fish and Wildlife. Sustaining and vitalizing fish stocks into the future is important for the success of fishing fleets and the Washington economy.
Relevant Information
Fisheries Specific Information
For specific information about fisheries including salmon, Dungeness crab, Groundfish, Pink Shrimp, albacore, spot shrimp, sardine, anchovy, hagfish, and razon clams, read the full Sector Analysis Report on Commercial Fishing.
General Overview of the Commercial Fishing Sector
The Washington commercial fishing industry, inclusive of aquaculture production and
tribal fisheries, is one of the most productive and valuable in the U.S. According to the
annual NOAA Report, “Fisheries of the United States, 2012,” Washington ranked fourth
in landed pounds (420.1 million) in 2012, and fifth in value of landings ($302.0 million)
(NMFS 2013a). These figures represent four percent of the total landings and six percent
of the total value of all U.S. commercial fisheries.
The ports of Westport and Ilwaco/Chinook, both located within our study area, rank
among the most important commercial fishing ports in the country. Westport was ranked
13th by landed weight in 2012 (133 million pounds) and 16th by landed value ($59 million). Ilwaco/Chinook was ranked 30th by landed weight (29 million pounds) and 50th
by landed value ($22 million) (NMFS 2013a).
Washington ranked below California and Oregon in 2012 in commercial fishing landings
by weight, but above these states in landings by value (NMFS 2013a). Its most valuable harvested species included Dungeness crab ($59,485,000), albacore tuna ($28,440,000), and salmon (multiple species) ($28,398,000) (NMFS 2013b).
Commercial landings at ports within our study area (i.e., from Neah Bay to the mouth of
the Columbia River) account for a substantial share of landings statewide: 83 percent of
landings by weight and 63 percent of landings by value (DFW 2008). The value of
landings at ports in Grays Harbor County (including Aberdeen, Bay City, and Westport)
is the highest in the state ($19,262,100 in 2006), accounting for approximately 30 percent
of ex-vessel revenues statewide (DFW 2008).
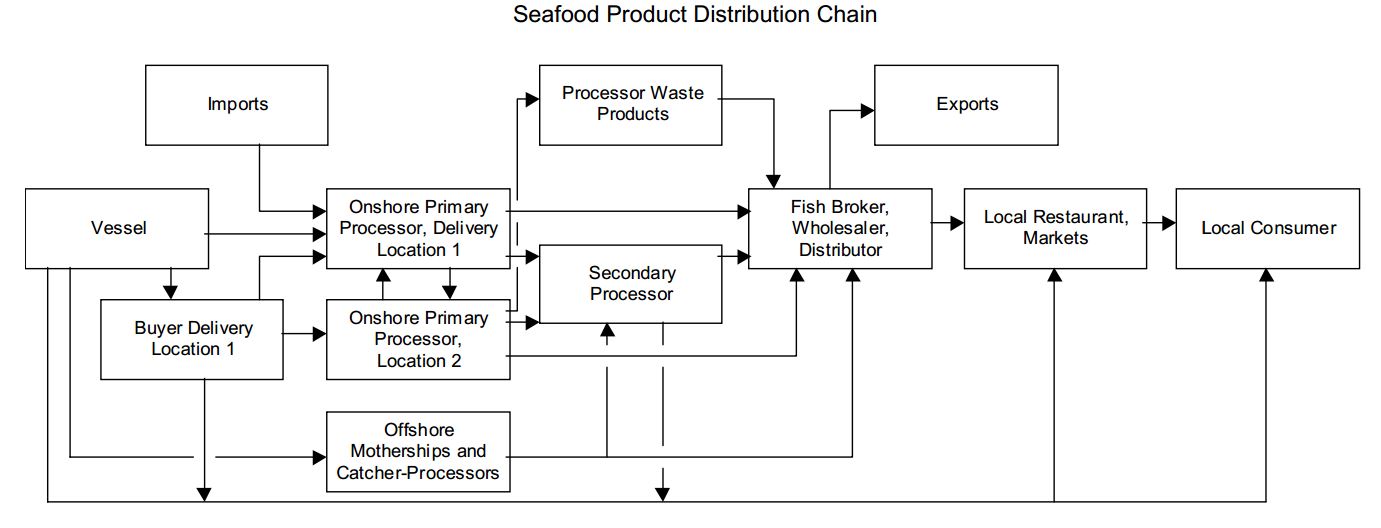
The diagram below shows the general flow of seafood from harvest to consumer. The majority of
the harvest landed in Washington is delivered to one of the many onshore processors
located within the state; in 2006, there were 104 seafood processing facilities based on
the Washington coast (TRG 2008). A share of the commercial Pacific whiting (aka
Pacific hake) catch, however, is processed at sea. In addition, onshore processing
capacity has seen some consolidation in recent years. As a result, the port at which the
harvest is landed does not necessarily realize the economic benefits of related processing
activity (DFW 2008).
According to a 2006 report published by the Pacific States Marine Fisheries Commission
(PSMFC), the majority of processing companies on the U.S. west coast depend upon
multiple species and markets. In addition, there has been a trend towards multi-species
dependency for high volume processors (PSMFC 2006). Factors that have affected the fish processing industry since the early 1990s include:
- Infrastructure issues related to whether water or byproduct use in the processing
process will overwhelm existing infrastructure; - A decline in wholesale prices for seafood;
- Major expansion of the onshore Pacific whiting fishery;
- Horizontal integration of processors and consolidation of processing plants in
fewer locations; - Vertical integration into distribution and harvesting operations;
- Return of small processors to offering specialty products in niche markets.
 Source: PSMFC 2006
Economic Contribution of Commercial Fishing
Several recent studies, summarized below, provide insight into the regional economic
importance of the commercial fishing industry in Washington. Note that these studies are
generally focused on commercial fishing as a whole, and most do not differentiate
between activity within the study area (i.e., the outer coast) and outside the area (i.e., in
Puget Sound and the Strait of Juan de Fuca). Some include aquaculture, distant-waters
fisheries, and tribal fisheries, and thus are not representative of the portion of the industry
of interest to this effort. Comparison between these studies is not appropriate, as each
focuses on different components of Washington’s fishing industry.
DFW and The Research Group Reports
The 2008 DFW Report “Economic Analysis of the Non-Treaty Commercial and Recreational Fisheries in Washington State” responded to a request by then-Governor Christine Gregoire to “summarize the economic benefit that our commercial and recreational fisheries provide to the state” (DFW 2008). This study provides perhaps the most valuable existing information for our purposes, as it excludes aquaculture, tribal
fisheries, and distant water fisheries from the analysis. However, results are reported
statewide, and do not allow us to isolate that portion of the value of commercial fishing
activity attributable to harvests within the study area.
DFW (2008) relied in part upon information contained in The Research Group’s (TRG) 2008 report “Washington Commercial Fisheries Economic Value in 2006.” We report the values reported in TRG (2008) because they are presented in more detail (e.g., are broken down by species), but note they are slightly different from what was ultimately reported in DFW (2008).
TRG (2008) found that the commercial fishing industry was responsible for $148 million
in total personal income contributions, representing 3,530 jobs in Washington in 2006.
Although only representing a small fraction of total net earnings in Washington, this
income and these jobs are important to the economy of many individual communities on
the Washington coast and in Puget Sound. The net economic revenue generated by
commercial fishing was $38 million. The Dungeness fishery contributed the greatest
income, number of jobs, and net economic benefit of all fisheries (see below).
It is worth noting that the Seattle Marine Business Coalition took exception to the
findings of this report, and funded a study to develop what they believed to be the true
economic value of Washington’s commercial fisheries (Seattle Marine Business Coalition
2011). By including components of the fishery that they argue account for 28 percent of
Washington harvest values (i.e., tribal fisheries, distant-water fisheries, and aquaculture),
they report a total net economic value of Washington’s commercial fisheries as $3.9
billion (including recreational fisheries).

Community Attributes, Inc. Report
In 2013, Community Attributes, Inc. published a study for the Economic Development Council of Seattle and King County and the Workforce Development Council of Seattle-King County investigating the economic impacts of the sectors that comprise Washington’s maritime industry cluster, including Fishing and Seafood Processing (Community Attributes, Inc. 2013). Measures provided include direct impacts (gross business income and employment), indirect/induced impacts (employment and induced/indirect revenues/output), and wages. The results of the analysis are not directly applicable to the present analysis, as it includes tribal fishing, recreational fishing,
aquaculture/fish farming, and distant-waters fisheries. However, it could provide useful
context for ultimately understanding the overall contribution of coastal non-tribal
fisheries to the state’s commercial fishing industry as a whole.
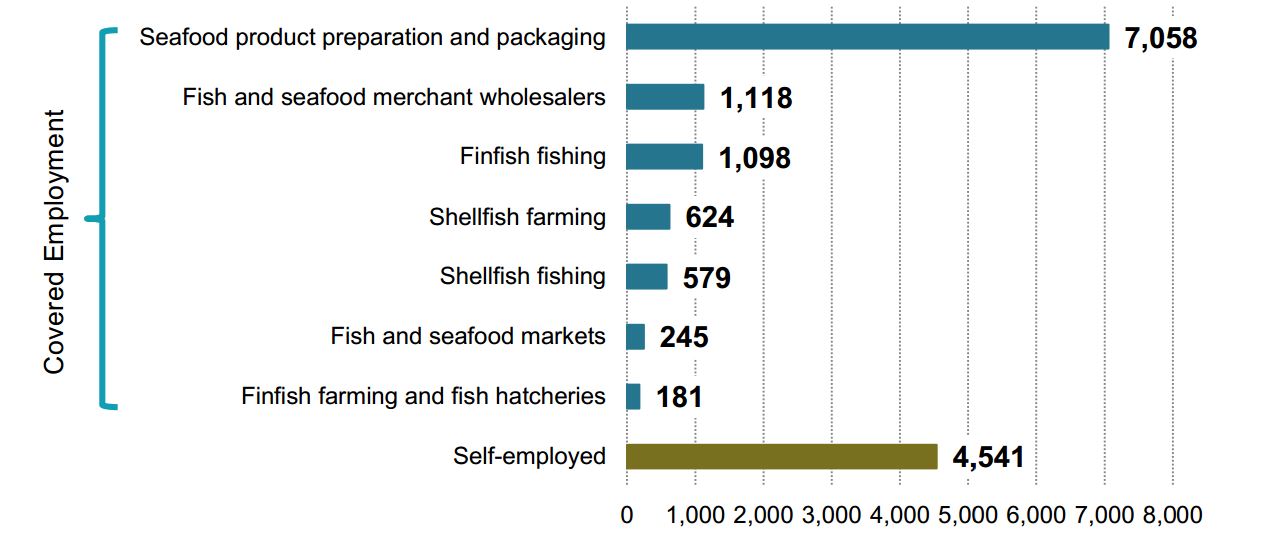
The analysis identified 720 establishments providing covered employment in the fishing
and seafood processing sector, and found a trend toward consolidation of businesses.
However, it also identified steady and even growing employment in the sector, with
approximately 11,000 jobs provided in 2011 (not including self-employed individuals
such as many fishermen (4,541 jobs)). The diagram below describes the number of jobs that are
supported by various sub-sectors of the Fishing and Seafood Processing sector. The
study calculated a total jobs multiplier for this sector as 3.0, meaning that for every job in
the sector, an additional two jobs are supported by fish and seafood processing activities.
Total wages generated by this sector were $1.1 billion. Gross business revenues were
estimated as $8.6 billion, and the sector contributed an estimated $135.7 million in tax
revenues to the state.
Fisheries of the United States
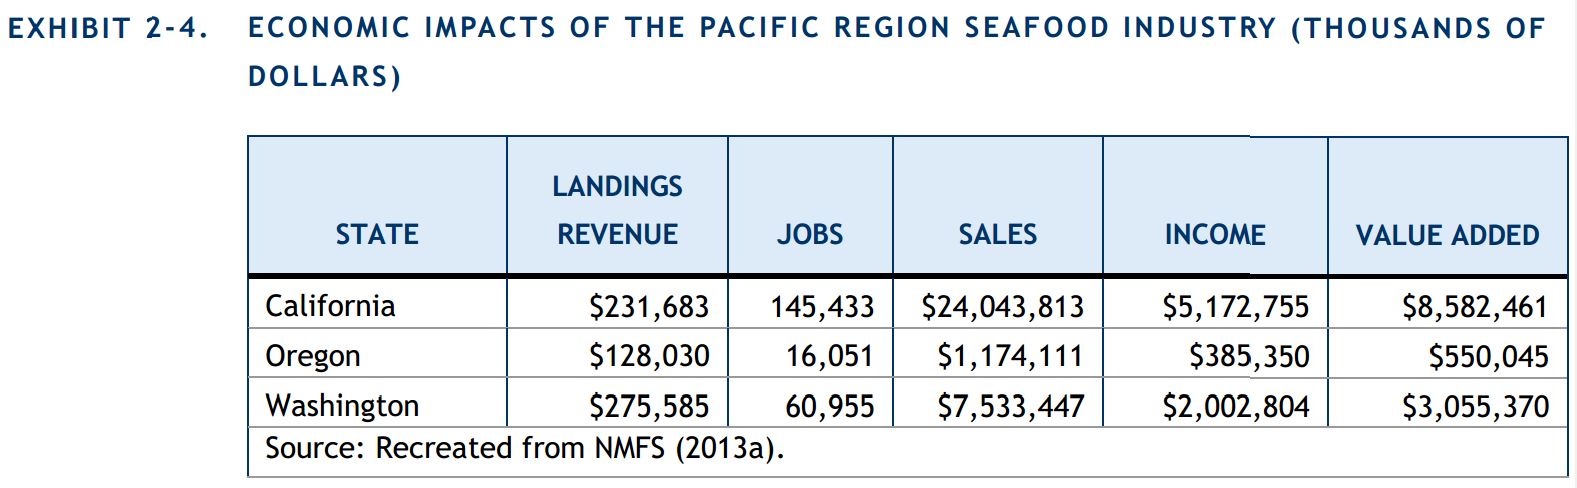
The 2013 NOAA report “Fisheries of the United States, 2012” reports that Washington’s
seafood industry was responsible for 60,955 jobs, $7.5 billion in sales impacts, and $2.0
billion in personal income, and contributed $3.0 billion in value added to the economy
(NMFS 2013a) (see below). These figures are not, however, strictly representative
of the segment of the fishing industry of interest to this report, as they include tribal
fisheries, aquaculture, and distant waters fisheries, and are inclusive of all state waters.
Expert Summaries: History, Trends, and Opportunities
The state of Washington has long been home to a vibrant and diverse fishing industry.
The Native American tribes in the region have been fishing for salmon, halibut and
shellfish for thousands of years, and European settlers have been fishing commercially in
the region since they arrived in the mid-1800s (Community Attributes, Inc. 2013).
List of Non-Tribal Fisheries Described in the Sector Analysis
| Commercial | Recreational |
|
|
Influences on Commercial Fishing
A number of events have substantially influenced the trajectories of the commercial and
recreational fisheries in Washington, including federal court decisions associated with
tribal treaty fishing rights. In United States vs. Washington (1974), Judge George Hugo
Boldt held that Washington’s native American treaty tribes reserved the right to take up
to 50 percent of the harvestable salmon in their respective usual and accustomed (U&A)
fishing grounds (384 F. Supp. 312 (W.D. Wash. 1974)). This ruling was also the basis
for their co-management of the fishery with the state. Twenty years later, in subsequent
cases under United States vs. Washington (1994), Judge Edward Rafeedie held that the
treaty right extended to finfish other than salmon, and shellfish, including oysters, clams,
and Dungeness crab (OCNMS IPC 2008). These rulings increased tribal involvement in
a number of commercial fisheries, and reduced the quantity of salmon available for
harvest by non-tribal fishery participants. The state/tribal management plans to
implement these decisions also include “special management areas,” which are closed to
non-tribal Dungeness crab fishing at certain times of the year, concentrating a lot of the
commercial fishing activity into the southern portion of the coast, particularly at the start
of the season (Personal comm. D. Beasley 2014, Personal comm. L. Thevik 2014,
Personal comm. K. Krueger 2014, Personal comm. M. Culver 2014).
Decline in the Salmon Resource
Another significantly influential event has been the decline in the salmon resource itself
due to factors such as loss of in-river habitat. This has resulted in a significant reduction in the number of salmon available for harvest by the tribal and non-tribal commercial and
recreational fisheries alike (Personal comm. M. Cedergreen 2014, Personal comm. L.
Thevik 2014, Personal comm. D. Beasley 2014, Personal comm. K. Krueger 2014).
Changes in the Fleet
These factors and others have substantially changed the characteristics of Washington’s
commercial and recreational fisheries. The sizable fleet that developed to target salmon
up until the 1970s now operates at a fraction of its former capacity (Personal comm. L.
Thevik 2014). Where non-tribal Dungeness crab commercial fishermen had historically
been able to rely upon participation in one fishery to sustain them financially, fishermen
today must participate in three to four fisheries in order to survive, which is more typical
of participants in fisheries that depend upon resource availability (e.g., salmon, albacore
tuna, sardines) (Personal comm. M. Culver 2014, Personal comm. D. Beasley 2014). The
lucrative Dungeness crab fishery that historically was dominated by coastal residents has
seen an influx of vessels from Oregon, Alaska, and Seattle (Personal comm. L. Thevik).
The commercial fishery participants are affected by competition from out-of-state, and other factors influencing wild fish populations, such as impacts on fish habitat (Personal comm. K.
Krueger).
Commercial Trawling Fleet
Another major change has been the near complete loss of Washington’s trawling fleet.
This loss was primarily due to the federal trawl buyback program, which bought out 92
permits along the West Coast, including five of Washington’s seven major trawlers
operating out of Bellingham, in 2005. This buyback was implemented through a loan
from the federal government, which the remaining trawlers are paying back through a
dedicated landing tax. This buyback was fully supported by the trawl industry via
referendum in recognition of the overcapacity of the fleet. The Pacific Fishery
Management Council (PFMC) worked with the trawl industry to develop a Strategic Plan
in 2000, which called for a fleet reduction of 50 percent; the buyback program was one of
the key steps to accomplishing this goal. While the full 50 percent target reduction was
not achieved, the buyback program reduced the total number permits to the current level
of 167.
Summary of Key Issues
| Issue | Concerns |
| Barriers to Entry an Success |
|
| Limitations in Use of Space |
|
| Ocean Acidification |
|
| Oil Industry Conflict |
|
| Overfished Species |
|
| Potential for Concentration of Ownership |
|
| Regulatory Uncertainty |
|
| Salmon Production and Survivability |
|
| Resource Sharing with Tribes |
|
Data Gaps for Commercial Fishing
The sector analysis report for non-tribal commercial fishing identified a number of gaps in the existing information that limited the development of a complete characterization of the sector. The most important data issues are described below.
- Employment data: Many fishermen are self-employed and thus are not captured
in traditional sources of employment statistics. This information is critical to
developing an accurate estimate of the economic impact of the industry. - Ecomonic impacts of ocean-based commercial fishing: Previous studies have
provided information on the economic impact of commercial fishing in
Washington. However, most analyses have included components of the industry
outside the scope of interest (e.g., aquaculture, tribal fisheries and distant waters
fisheries). We found very little information that helps us understand the economic
impact of the specific segments of the commercial fishing industry that are of
interest in developing the MSP for Washington’s outer coast. - Economic impacts of ocean-based recreational fishing: Previous studies have
provided information on the economic impact of marine recreational fishing in
Washington. However, most analyses are conducted on a statewide basis, and
cannot be isolated to our study area/counties of interest. We found very little
information specifically focused on the economic impacts of recreational fishing
along Washington’s outer coast. - Processor data: Previous studies have provided information on the economic impact of marine recreational fishing in Washington. However, most analyses are conducted on a statewide basis, and cannot be isolated to our study area/counties of interest. We found very little information specifically focused on the economic impacts of recreational fishing along Washington’s outer coast.
- Recreational Dungeness crab fishery: DFW does not track effort or catch in the
outer coast’s recreational Dungeness crab fishery. Note, however, that this
segment is a very small contributor to the overall recreational Dungeness crab
fishery, and thus might not be critical to the economic analysis.
Key Economic Questions
A number of existing studies have examined the economic impacts of the commercial and
recreational fishing industry on the Washington economy. However, there are a number
of questions not thoroughly addressed by previous research that should be considered in
the design of the forthcoming economic analysis. These questions are described briefly
below.
- Definition of the potentially affected industry: What is the most appropriate way
to define and bound the fishing industry potentially affected by decisions made in
the marine spatial planning process? Should the focus remain on non-tribal
fisheries whose catch comes from Washington’s outer coast, or should the scope
of the analysis be expanded to provide a more complete understanding of the
potentially affected industry and its economic reach? - Distant Waters Fisheries: To what extent do distant water fisheries (e.g.,
Washington-based vessels fishing in Alaska) generate revenues that are
brought into the Washington state economy? Should this activity be
included in the analysis? - Tribal Fisheries: What value are tribal fisheries bringing to the
Washington state economy? Should this activity be included in the
analysis? - Economic contribution of outer coastal fisheries: Nearly all available data on
economic impacts identified though the present process is reported at the state
level, and includes the aquaculture and/or tribal fishing industry. What economic
contributions are specifically made by the fisheries operating off Washington’s
outer coast? - Indirect services: How do/should we quantify services that are indirectly provided
by the fishing industry (e.g., the indirect benefits provided by a seafood
processing plant that purchases enough water from a public water supply system
to reduce the share of the system’s capital costs that must be borne by other
members of the community, or the indirect benefits to recreational boaters that
stem from dredging and other navigation improvement projects undertaken to
allow commercial fishing vessels to access fishing ports ). - Indirect recreational fishing value: Can/should we quantify the economic
contributions made to coastal communities when an individual’s planned fishing
trip results in the rest of his family visiting the coast, shopping, eating, and
contributing to the economy? - Community fabric/social value: How do/should we quantify or characterize the
non-monetary contributions made by members of the fishing industry to their
communities (e.g., through service on school boards, as volunteer firefighters,
etc.)
Fisheries Specific Information
For specific information about fisheries including salmon, Dungeness crab, Groundfish, Pink Shrimp, albacore, spot shrimp, sardine, anchovy, hagfish, and razon clams, read the full Sector Analysis Report on Commercial Fishing.