

Recreational fishing is a large part of the economy in Washington state. Various gear types and are used throughout Washington waters and are largely managed by the Department of Fish and Wildlife. Sustaining and vitalizing fish stocks into the future is important for the success of fishing fleets and the Washington economy.
Relevant Information
Fisheries Specific Information
For specific information about fisheries including razor clam, Dungeness crab, Albacore tuna, Bottomfish, Halibut, and Salmon, read the full Sector Analysis Report on Recreational Fishing.
General Overview of Recreational Fishing
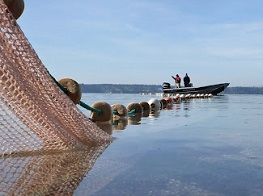
Recreational fishing on the Washington coast is primarily a boat-based activity that
occurs offshore. There is little activity in coastal bays or estuaries, or from the shore.
Approximately 60 percent of the coastal recreational fishing activity occurs along the
southernmost part of the coast, from Point Grenville to the Columbia River, largely due to
there being more ports and thus greater accessibility (Personal comm. M. Cedergreen
2014).
The recreational fishing sector supports two distinct components – a for-hire (i.e., charter
boat) fleet, and a private vessel fleet. The for-hire fleet ranges from 26 to 65 feet in
length and carries between four and thirty anglers, while private vessels generally range
from 16 to 50 feet and carry between two and ten anglers. There has been a recent trend
towards larger, more powerful private vessels that are capable of going further offshore.
Coastwide, approximately 40 percent of recreational fishing trips are taken on charter
vessels, and 60 percent are taken on private vessels (Personal comm. M. Cedergreen
2014).
Salmon and groundfish are the most important target species for the recreational non-tribal fishing industry. Other important species include albacore tuna and halibut, with Dungeness crab ranking a very distant fifth (Personal comm. M. Cedergreen 2014).
The Washington coast supports several major port areas. The Columbia River is home to
two major ports, Ilwaco and Chinook, which focus primarily on salmon and Columbia
River sturgeon. Approximately 25 percent of trips from these ports are on charter
vessels, with 75 percent on private vessels. Westport is another major port, and a hub of
recreational fishing activity. The Westport fleet focuses on salmon and groundfish, as
well as halibut and albacore. Nearly 75 percent of trips out of Westport are taken on
charter vessels. Together, Ilwaco/Chinook and Westport are responsible for approximately 75 percent of coastal angler trips (both private and for-hire). To the north, the ports of La Push and Neah Bay, which are located on tribal lands, are also important. Charter trips are much more limited in these ports, with approximately 10 percent and 20 percent of trips occurring on charter vessels, respectively (Personal comm. M. Cedergreen 2014).
The vast majority (perhaps 85 to 90 percent) of participants in Washington’s coastal
recreational fisheries are state residents, with most coming from along the Interstate 5
corridor. This is largely due to the fact that the Washington coast is relatively
inaccessible, and lacks the substantial tourism infrastructure that characterizes other
fishing destinations, such as those in Oregon (Personal comm. M. Cedergreen 2014).
During the 2012-2013 fishing season, DFW reports that a total of 720,000 anglers
purchased recreational fishing licenses to participate in the State’s fresh and marine water
fisheries (Personal comm. M. Culver 2014). DFW issues a variety of licenses that permit
different types of fishing activity in the state’s waters. Licenses relevant to recreational
activity within our study area include Saltwater, Combination (Saltwater/Freshwater/Shellfish), Shellfish/Seaweed, and Razor Clam licenses. Licenses may be issued on an annual or temporary basis. Temporary licenses allowing harvest in coastal areas include a 1-, 2-, or 3-day combination license, and a 3-day razor clam license. As licenses are not fishery or location-specific, it is not possible to isolate the total number of licenses sold with the intent of participation in any of the fisheries or locations of specific interest to this report.
Participation and Economic Contribution of Marine Recreational Fishing
Participation and spending on recreational fishing in Washington is part of a billion dollar
industry (DFW 2008). Several recent sources discuss the economic importance of marine
recreational fishing, either to the U.S. as a whole or to Washington specifically. These
studies, which are summarized below, provide some insight into the economic
importance of recreational fishing and shellfishing in coastal Washington. However,
these studies are generally focused on marine recreational fishing as a whole, and
generally do not differentiate between activity within our study area (i.e., the outer coast)
and activity elsewhere (i.e., in Puget Sound and the Strait of Juan de Fuca).
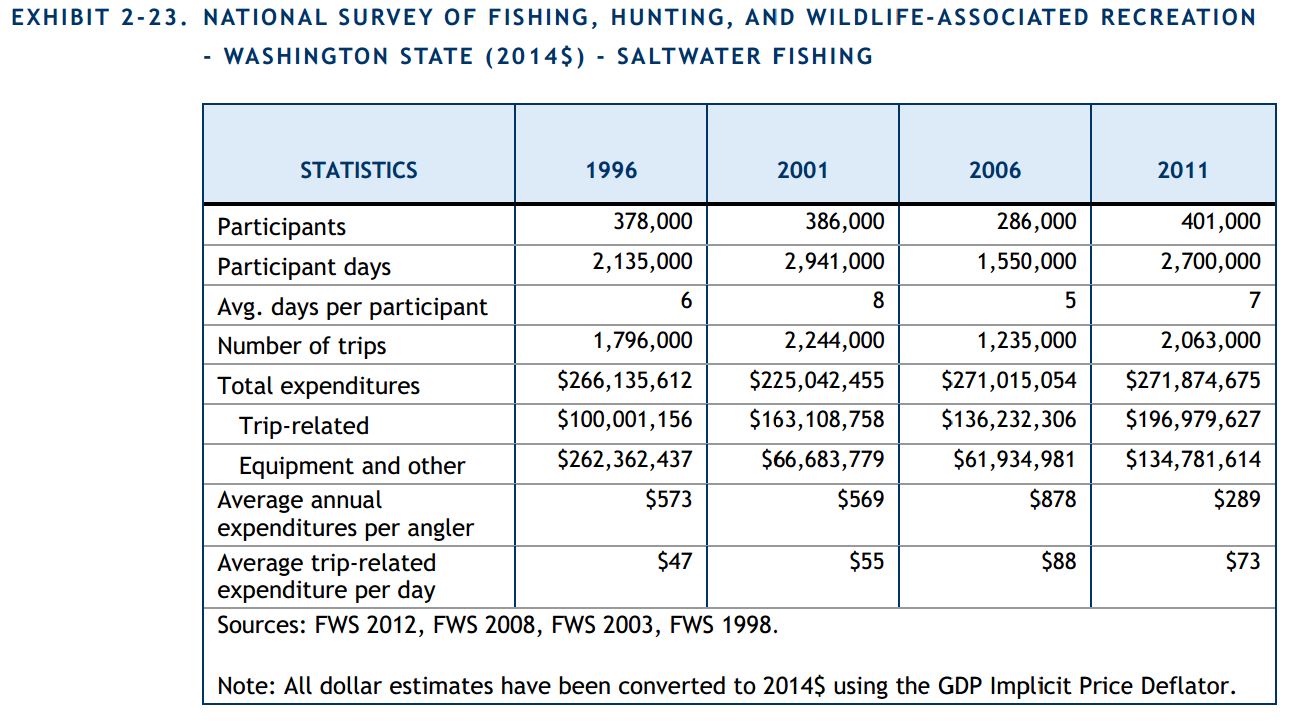
National Survey of Fishing, Hunting, and Wildlife-Associated Recreation
The U.S. Fish and Wildlife Service conducts its National Survey of Fishing, Hunting, and Wildlife-Associated Recreation every five years (FWS 2011). The survey provides statewide figures on participation in outdoor recreational activities and expenditures associated with those activities, including saltwater fishing. The figure below presents the saltwater fishing data for Washington for the last four surveys. In 2011, 401,000 participants fished for a total of 2.7 million fishing days. Total expenditures on saltwater fishing in Washington were $2.7 million. The figure in the next section presents the data for fishing days and total expenditures graphically, and shows that total fishing effort has not followed a particular trend, ranging from 1.6 million in 2006 to 2.9 million in 2001. Further, as the exhibit indicates, expenditures have not necessarily followed the same pattern as participation. Note that these statewide results may not be representative of our study area, since they are based in part on activity in other locations (e.g., Puget Sound).
DFW Analysis of Non-Treaty Commercial and Recreational Fisheries
In 2008, DFW published an economic analysis of the non-treaty commercial and
recreational fisheries in Washington State. The report sought to estimate the economic
benefits generated by commercial and recreational fishing in 2006, and provides a variety
of data on recreational harvest, participation, and economic impacts.
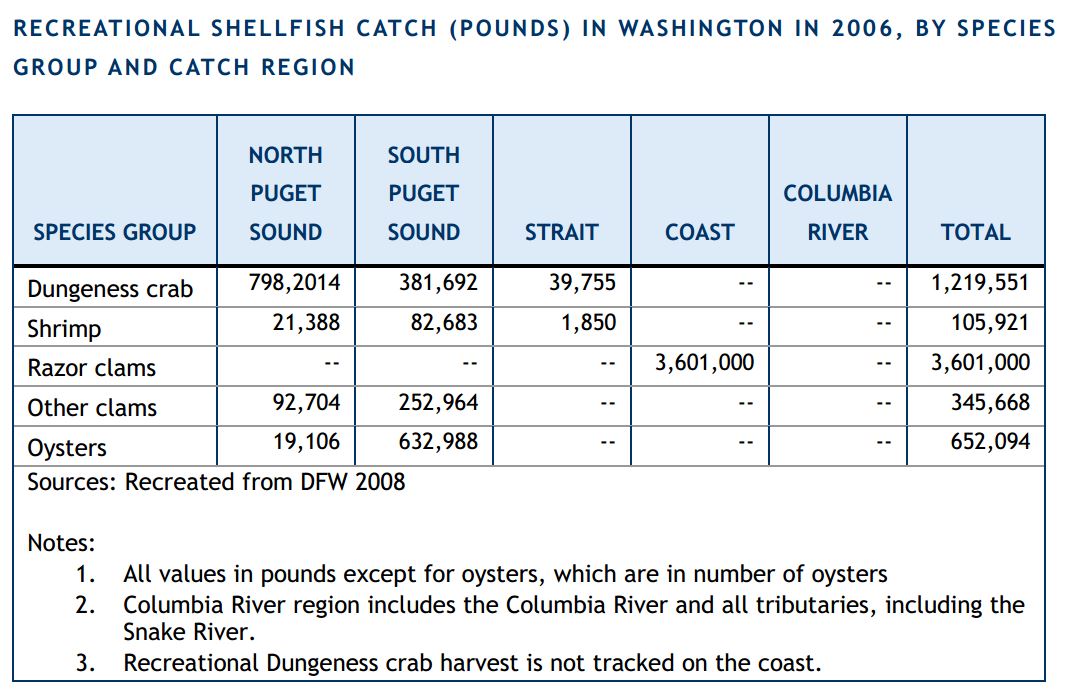
The table below presents the total recreational catch of finfish by species originating from
each of the study regions. Of the total recreational finfish catch of 843,636 fish, 46
percent was caught within the waters of our coastal study area. Catches of several marine
species were heavily weighted toward the coast, including bottomfish (72 percent),
Pacific halibut (67 percent), and albacore tuna (100 percent).

In contrast, recreational harvest of shellfish predominantly occurs outside of the study area, with the exception of razor clams. 100 percent of the total recreational razor clam harvest in 2006 came from the coast (see below).
DFW’s economic analysis reported data on angler expenditures, the net economic value
of recreational fishing, and the economic impacts of this activity. The angler
expenditures employed in this analysis came from the 2008 FWS National Survey of
Fishing, Hunting, and Wildlife-Associated Recreation and are not reported here, since
more recent data are available (see above). Relative to net economic value, the study
reviewed previous studies on angler willingness to pay for fishing opportunities, and
found those values to be $58/day for marine salmon fishing and $60/day for other marine
fishing. These values resulted in a net economic value of marine recreational fishing of
$81.8 million. Although the report identifies the direct, indirect and induced impacts of
recreational fishing in some detail, they are reported for saltwater and freshwater
recreational fishing collectively, and thus are of limited utility in describing the economic
impacts of recreational fishing in our study area.
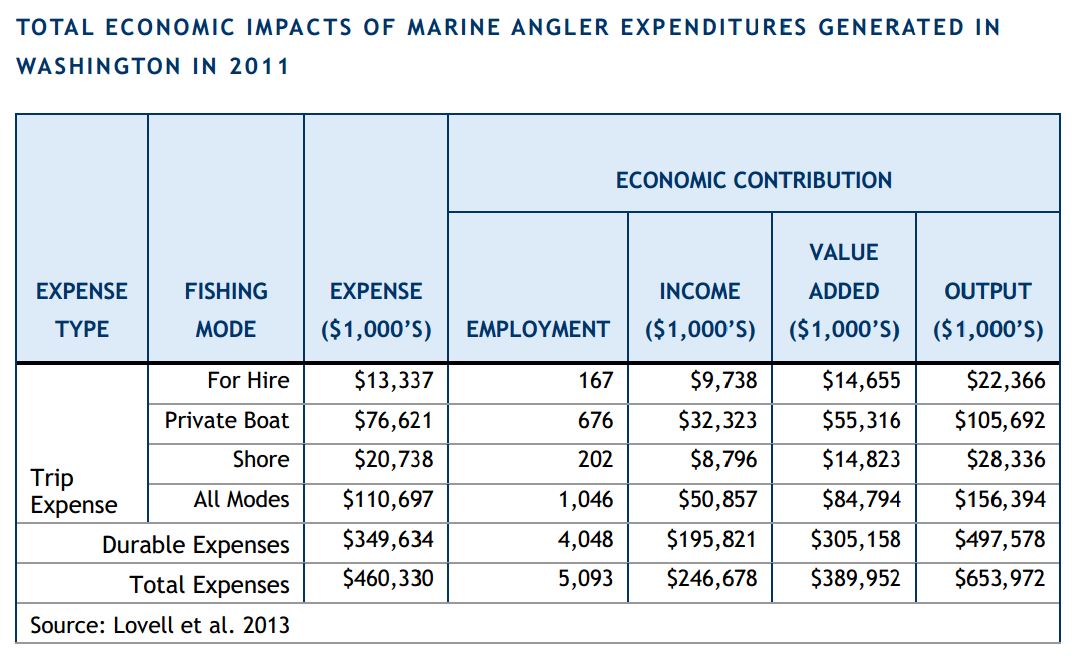
NOAA Analysis of Marine Angler Expenditures in the United States, 2011
A 2013 report by Lovell et al. for NOAA reports that anglers spent a total of $460 million
on marine recreational fishing in Washington in 2011. It further reports that marine
recreational fishing in Washington contributed 5,100 jobs to the economy, generated
$654 million in sales, contributed $390 million to the state’s Gross Domestic Product,
and generated $247 million in income (see below). Marine recreational fishing in
Washington also generated $102,633,000 in federal and state taxes in 2011 (Lovell et al.
2013). Again, these results represent statewide marine fishing activity and are not limited
to our study area.
American Sportfishing Association Analysis
A 2013 report by the American Sportfishing Association reports the economic impact of
saltwater anglers in Washington (American Sportfishing Association 2013). In all
categories of impacts reported, saltwater fishing represents approximately 30 percent of
the economic impact generated by all forms of recreational fishing (see below).
This report does not allow us to isolate the economic impacts of recreational fishing in
our study area specifically, and includes data from Puget Sound/Strait of Juan de Fuca.
Charterboat Industry
As noted above, the charterboat industry is an important component of Washington’s
marine recreational fishing sector. The industry developed rapidly following World War
II, focusing almost exclusively on salmon through the 1960s. Between 1960 and 1977
there was tremendous growth in the industry, with approximately 500,000 people fishing
annually coastwide. Between 1977 and 1984, however, the charter boat industry
contracted significantly due to a decline in the salmon resource, new requirements to
share salmon resources with the treaty tribes, and overcapitalization of the fleet. At this
point fisherman began targeting new species such as groundfish and albacore, and
eventually halibut. Beginning in the mid-1980s charter boat activity began to stabilize,
and has been fairly stable since the 1990s. The decline from the historical peak, however,
is evident in communities like Westport, which supported approximately 230 charter
vessels in 1977 but today is home to only 30 such vessels (Personal comm. M.
Cedergreen 2014).
Although much of the information presented in the previous section includes the
charterboat component of recreational fishing, there are a number of sources that have
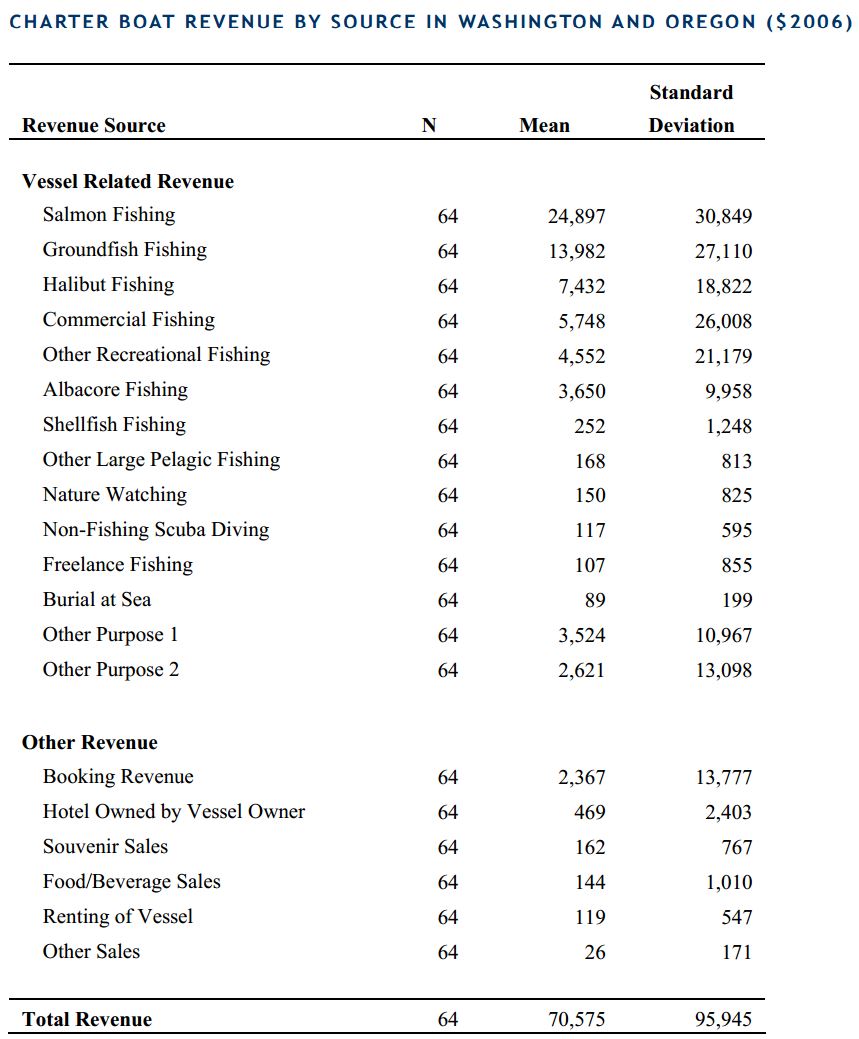
specifically analyzed the economics this sub-sector specifically. For example, a 2006
survey by Leonard and Watson (2013) provides the most recent, comprehensive data on revenue sources for the charter boat industry in Washington and Oregon, as well as estimates of the industry’s direct, indirect, and induced economic effects. The diagram below presents this information and focuses on the categories of revenue generated by charter vessels, allowing us to see the relative contribution of each to total revenue. These data indicate that salmon fishing provided the greatest contribution to the revenues of charter vessels in the Northwest, followed by groundfish.
This diagram presents this information and outlines expenses incurred by charter vessels. The greatest expenditures made by these businesses are for fuel, captain’s fees, and government taxes and fees.

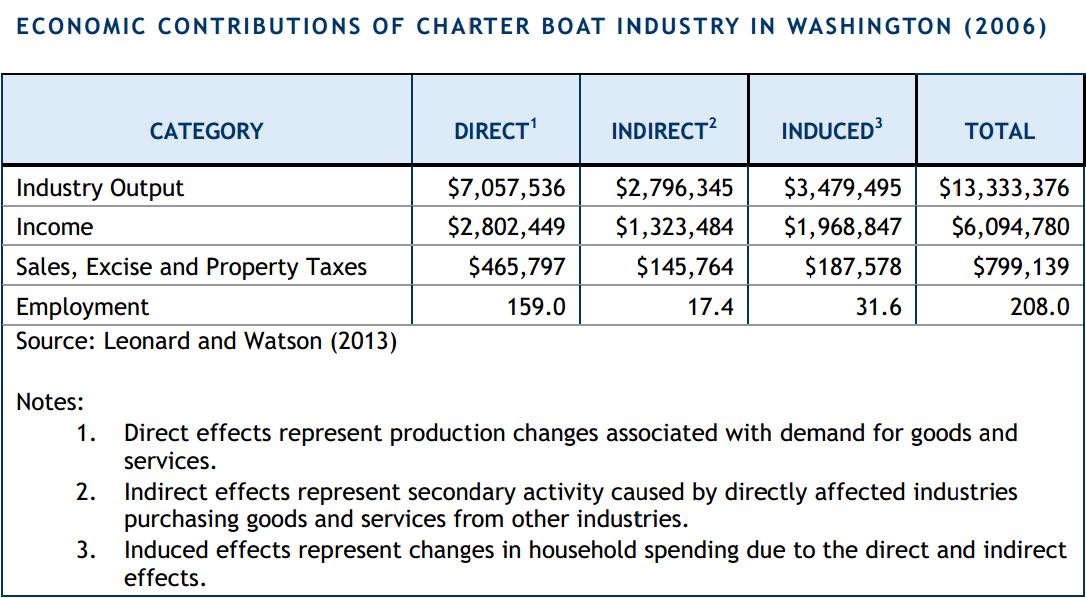
Finally, this diagram describes the economic contributions of the charter industry in Washington. The analysis found that the charter boat industry contributed $13,333,376 in industry output,
$6,094,780 in income, and $799,139 in taxes to the Washington economy. It also
accounted for a total of 208 jobs statewide.
Expert Summaries: History, Trends, and Opportunities
Recreational fishing on the Washington coast is primarily a boat-based activity that
occurs offshore. There is little activity in coastal bays or estuaries, or from the shore.
Approximately 60 percent of the coastal recreational fishing activity occurs along the
southernmost part of the coast, from Point Grenville to the Columbia River, largely due to
there being more ports and thus greater accessibility (Personal comm. M. Cedergreen
2014).
The recreational fishing sector supports two distinct components – a for-hire (i.e., charter
boat) fleet, and a private vessel fleet. The for-hire fleet ranges from 26 to 65 feet in
length and carries between four and thirty anglers, while private vessels generally range
from 16 to 50 feet and carry between two and ten anglers. There has been a recent trend
towards larger, more powerful private vessels that are capable of going further offshore.
Coastwide, approximately 40 percent of recreational fishing trips are taken on charter
vessels, and 60 percent are taken on private vessels (Personal comm. M. Cedergreen
2014).
Salmon and groundfish are the most important target species for the recreational non-tribal fishing industry. Other important species include albacore tuna and halibut, with Dungeness crab ranking a very distant fifth (Personal comm. M. Cedergreen 2014).
The Washington coast supports several major port areas. The Columbia River is home to
two major ports, Ilwaco and Chinook, which focus primarily on salmon and Columbia
River sturgeon. Approximately 25 percent of trips from these ports are on charter
vessels, with 75 percent on private vessels. Westport is another major port, and a hub of
recreational fishing activity. The Westport fleet focuses on salmon and groundfish, as
well as halibut and albacore. Nearly 75 percent of trips out of Westport are taken on
charter vessels. Together, Ilwaco/Chinook and Westport are responsible for approximately 75 percent of coastal angler trips (both private and for-hire). To the north, the ports of La Push and Neah Bay, which are located on tribal lands, are also important. Charter trips are much more limited in these ports, with approximately 10 percent and 20 percent of trips occurring on charter vessels, respectively (Personal comm. M. Cedergreen 2014).
The vast majority (perhaps 85 to 90 percent) of participants in Washington’s coastal
recreational fisheries are state residents, with most coming from along the Interstate 5
corridor. This is largely due to the fact that the Washington coast is relatively
inaccessible, and lacks the substantial tourism infrastructure that characterizes other
fishing destinations, such as those in Oregon (Personal comm. M. Cedergreen 2014).
During the 2012-2013 fishing season, DFW reports that a total of 720,000 anglers
purchased recreational fishing licenses to participate in the State’s fresh and marine water
fisheries (Personal comm. M. Culver 2014). DFW issues a variety of licenses that permit
different types of fishing activity in the state’s waters. Licenses relevant to recreational
activity within our study area include Saltwater, Combination (Saltwater/Freshwater/Shellfish), Shellfish/Seaweed, and Razor Clam licenses. Licenses may be issued on an annual or temporary basis. Temporary licenses allowing harvest in coastal areas include a 1-, 2-, or 3-day combination license, and a 3-day razor clam license. As licenses are not fishery or location-specific, it is not possible to isolate the total number of licenses sold with the intent of participation in any of the fisheries or locations of specific interest to this report.
Data Gaps for Recreational Fishing
The sector analysis report for non-tribal commercial fishing identified a number of gaps in the existing information that limited the development of a complete characterization of the sector. The most important data issues are described below.
- Employment data: Many fishermen are self-employed and thus are not captured
in traditional sources of employment statistics. This information is critical to
developing an accurate estimate of the economic impact of the industry. - Ecomonic impacts of ocean-based commercial fishing: Previous studies have
provided information on the economic impact of commercial fishing in
Washington. However, most analyses have included components of the industry
outside the scope of interest (e.g., aquaculture, tribal fisheries and distant waters
fisheries). We found very little information that helps us understand the economic
impact of the specific segments of the commercial fishing industry that are of
interest in developing the MSP for Washington’s outer coast. - Economic impacts of ocean-based recreational fishing: Previous studies have
provided information on the economic impact of marine recreational fishing in
Washington. However, most analyses are conducted on a statewide basis, and
cannot be isolated to our study area/counties of interest. We found very little
information specifically focused on the economic impacts of recreational fishing
along Washington’s outer coast. - Processor data: Previous studies have provided information on the economic impact of marine recreational fishing in Washington. However, most analyses are conducted on a statewide basis, and cannot be isolated to our study area/counties of interest. We found very little information specifically focused on the economic impacts of recreational fishing along Washington’s outer coast.
- Recreational Dungeness crab fishery: DFW does not track effort or catch in the
outer coast’s recreational Dungeness crab fishery. Note, however, that this
segment is a very small contributor to the overall recreational Dungeness crab
fishery, and thus might not be critical to the economic analysis.
Key Economic Questions
A number of existing studies have examined the economic impacts of the commercial and
recreational fishing industry on the Washington economy. However, there are a number
of questions not thoroughly addressed by previous research that should be considered in
the design of the forthcoming economic analysis. These questions are described briefly
below.
- Definition of the potentially affected industry: What is the most appropriate way
to define and bound the fishing industry potentially affected by decisions made in
the marine spatial planning process? Should the focus remain on non-tribal
fisheries whose catch comes from Washington’s outer coast, or should the scope
of the analysis be expanded to provide a more complete understanding of the
potentially affected industry and its economic reach? - Distant Waters Fisheries: To what extent do distant water fisheries (e.g.,
Washington-based vessels fishing in Alaska) generate revenues that are
brought into the Washington state economy? Should this activity be
included in the analysis? - Tribal Fisheries: What value are tribal fisheries bringing to the
Washington state economy? Should this activity be included in the
analysis? - Economic contribution of outer coastal fisheries: Nearly all available data on
economic impacts identified though the present process is reported at the state
level, and includes the aquaculture and/or tribal fishing industry. What economic
contributions are specifically made by the fisheries operating off Washington’s
outer coast? - Indirect services: How do/should we quantify services that are indirectly provided
by the fishing industry (e.g., the indirect benefits provided by a seafood
processing plant that purchases enough water from a public water supply system
to reduce the share of the system’s capital costs that must be borne by other
members of the community, or the indirect benefits to recreational boaters that
stem from dredging and other navigation improvement projects undertaken to
allow commercial fishing vessels to access fishing ports ). - Indirect recreational fishing value: Can/should we quantify the economic
contributions made to coastal communities when an individual’s planned fishing
trip results in the rest of his family visiting the coast, shopping, eating, and
contributing to the economy? - Community fabric/social value: How do/should we quantify or characterize the
non-monetary contributions made by members of the fishing industry to their
communities (e.g., through service on school boards, as volunteer firefighters,
etc.)
Fisheries Specific Information
For specific information about fisheries including razor clam, Dungeness crab, Albacore tuna, Bottomfish, Halibut, and Salmon, read the full Sector Analysis Report on Recreational Fishing.