

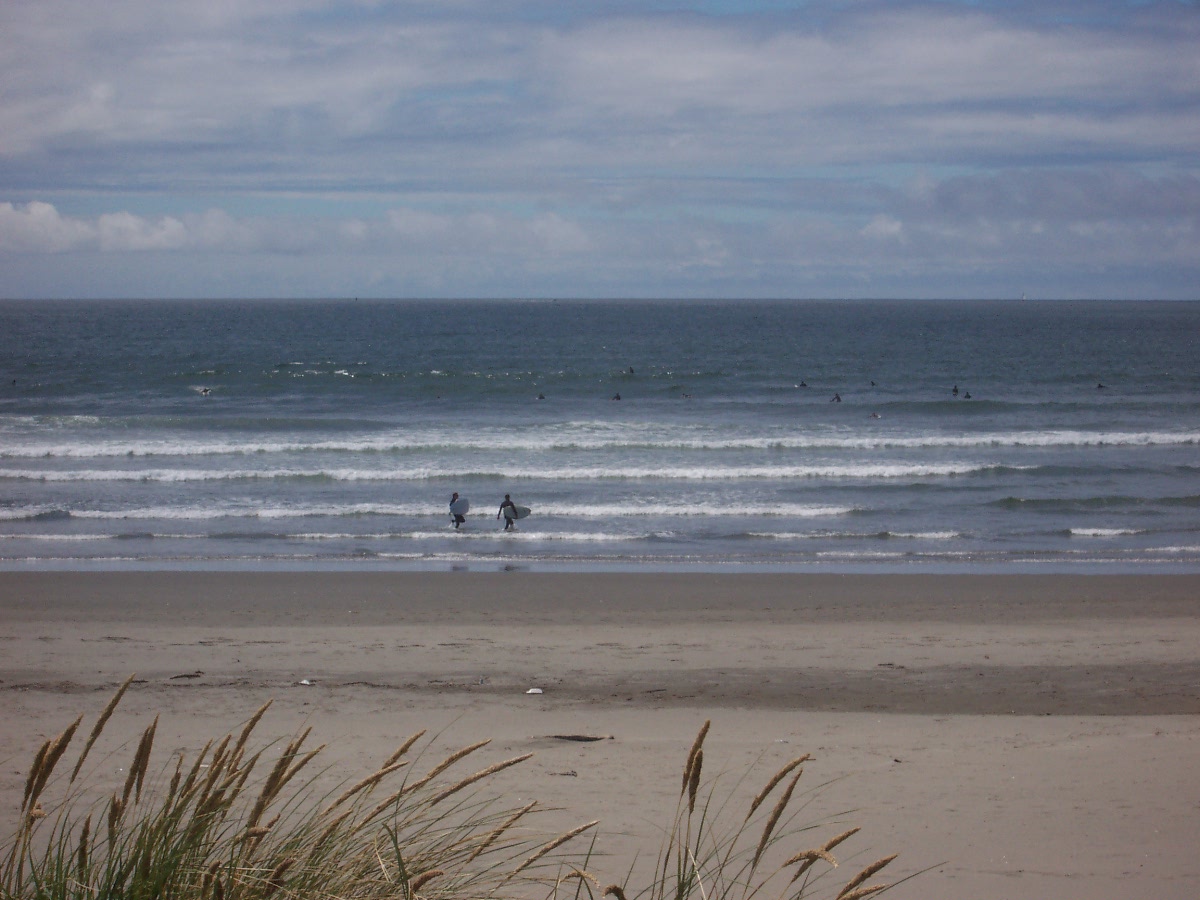
Recreational activities and coastal tourism bring visitors to Washington’s coast each season and supplement income for many state residents. Human activities include clamming, fishing, surfing, walking along the beach, birding, and so much more!
Relevant Information
Recreation and Tourism Specific Information
For specific information about fisheries including recreation sites by county, recreational boating information, economic impacts of parks and wildlife refuges, tourism on tribal lands, and existing laws, read the full Sector Analysis Report on Recreation and Tourism.
Sector Definition
The Washington Pacific coast provides numerous opportunities for recreation and tourism. The natural beauty of the coast and surrounding ecosystems attracts millions of visitors both from the Northwest region and from the rest of the country. The coast offers prime beach going experiences, as well as popular marine fishing and wildlife viewing opportunities.
For purposes of this analysis, the recreation and tourism sector is defined to include activity associated with recreational use or enjoyment of Washington’s Pacific coastal waters, as described in the report’s preface. This includes activity that occurs adjacent to the water, as well as activity on or in the water. We also note that recreational fishing is discussed in a separate report on the fishing sector.
History, Trends, and Opportunities
Washington’s Pacific coast has a long history of use for recreational purposes, dating to well before 1938, when President Franklin Roosevelt established Olympic National Park. In many respects, little has changed along the coast since Native American tribes first made it their home. Opportunities to enjoy the area’s natural environment, including the ocean, have always been a major draw for visitors, and remain so today.
Much of the state’s Pacific coast, excluding National Park and Indian Reservation lands, is included in the Washington State Seashore Conservation Area (SCA), established for public recreational use and enjoyment, and managed by the Washington State Parks and Recreation Commission (WSPRC). As recognized in the Washington State Seashore Conservation Act originally passed in 1967:
“The beaches bounding the Pacific Ocean from the Straits of Juan de Fuca to Cape Disappointment at the mouth of the Columbia River constitute some of the last unspoiled seashore remaining in the United States. They provide the public
with almost unlimited opportunities for recreational activities, like swimming, surfing and hiking; for outdoor sports, like hunting, fishing, clamming, and boating; for the observation of nature as it existed for hundreds of years before the arrival of Europeans; and for relaxation away from the pressures and tensions of modern life” (RCW.79A.05.600).”
As the preface to this report notes, there are major differences between the northern and southern portions of the Washington Pacific coast. The northern coast is dominated by high rocky sea cliffs, as well as islands and sea stacks scattered offshore. To the north, the major recreation features are Cape Flattery, Olympic National Park’s campgrounds and trails, several well-known surfing beaches, and various Tribal facilities, including lodging, marinas, and trails. The northern coast primarily attracts visitors looking to spend time connecting with nature.
The southern coast from the Quinault reservation to Cape Disappointment provides a different experience, allowing visitors to enjoy a natural setting while remaining connected to the amenities associated with more developed areas. The geography along the southern coast is dominated by long sandy beaches created by sand carried northward from the mouth of the Columbia River. In addition to coastal beach activities, peninsulas such as Point Brown, Damon Point, and Long Beach offer access to the protected, calmer waters of Grays Harbor and Willapa Bay, where watersports like kayaking, windsurfing, and paddleboarding are popular. The southern coastal area contains more than ten state park facilities, as well as several major coastal communities. The Westport Marina with 600 slips is the largest coastal marina in the Northwest and provides a base for the state’s largest charter fishing fleet (Port of Grays Harbor 2014).
Recreation and tourism are often the most popular human uses of coastal and marine settings (Lew 2014). The Washington Pacific coast is a very popular recreation and tourism destination, for both day and overnight trips. The region’s most prominent destination, Olympic National Park, receives an estimated three million visitors annually (NPS 2014). According to the National Ocean Economics Program, the recreation and tourism sector contributes more jobs to Washington’s ocean economy than any other sector (NOEP 2014).
The importance of tourism and recreation to coastal communities’ economies is well-recognized at the local level. For example, a recent report by the Grays Harbor Economic Development Council states, “[t]he beach is the driving force for tourism, a $30 million per year industry, in Grays Harbor” (Port of Grays Harbor 2014). Anecdotal evidence from interviews with local stakeholders indicates that for Ocean Shores, and likely for other coastal towns, tourism is the heart of all business (Personal comm. M. Plackett 2014). Interviewees for a previous economic analysis cited tourism activities as drivers of the economy and tax base for both ports and municipalities along Washington’s coast (University of Washington 2013).
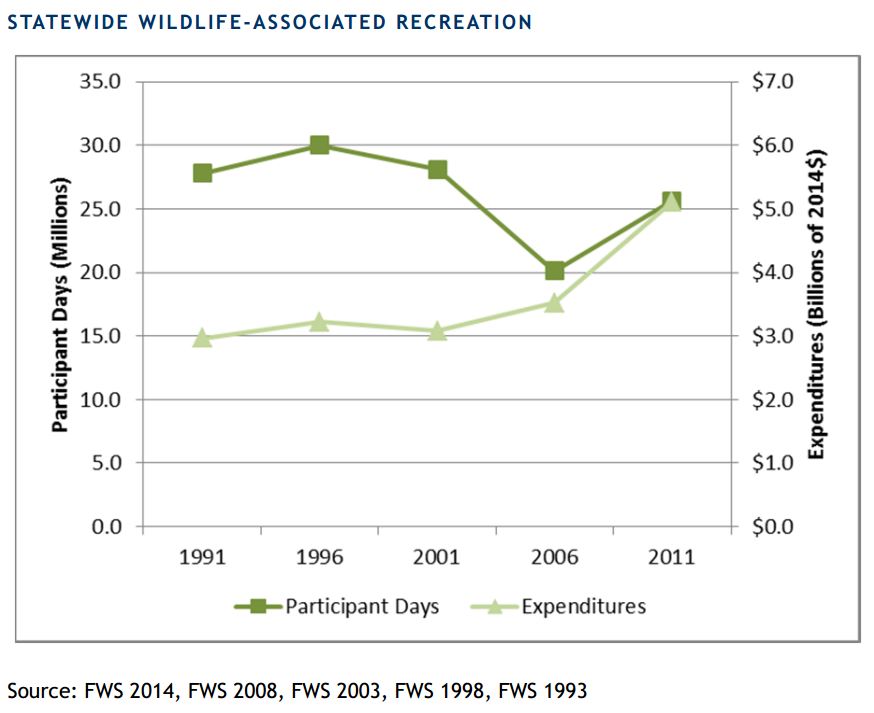
Detailed information on recreation and tourism visitation and expenditures in Washington’s coastal counties is not readily available; however, statewide trends are informative. Tourism statewide is slowly recovering following the economic slowdown that began in 2008. A recent profile for Pacific County states that the county’s reliance on tourism was hurt by high gas prices and the recession in general (WA State Employment Security Division 2012), but statewide data indicate that tourism in Washington State began to improve in 2013. Despite the recent downturn, the long-term trend statewide has been positive. From 2002 to 2012, for example, tourism destination spending in Washington increased from $9.3 billion to $14.5 billion (2014$) (Dean Runyan 2014). Similarly, expenditures associated with wildlife-related recreation in Washington State have experiencedlong-term growth, despite inconsistent trends in overall participation (see below).
In a trend related to tourism, development of second-home communities that incorporate amenities and a rental program have become popular along the southern coast. Seabrook, a beach town designed around new urban principles, was founded in 2005 just south of Pacific Beach. This development currently includes 250 homes (half of which are in the Seabrook Cottage Rentals program), and is slated to expand to a total of 300 homes and over 450 units (Seabrook 2014). The town includes beach access and has its own retail district. A smaller but similar project has been proposed for development in Ocean Shores (Bruscas 2013).
Summary of Key Issues
In our discussions with local experts, we identified no major issues currently affecting the recreation and tourism sector. There is concern, however, about the impact of potential future marine renewable energy projects on recreational fishing and other water sports, such as surfing. In addition to these concerns, the table below highlights issues that may affect ocean-derived recreation and tourism in the study area. A detailed description of these issues is provided in the full sector analysis report. In addition, details on issues affecting recreational fishing are included in a separate fishing sector report.
| Issue | Concerns |
| Access issues |
|
| Marine renewable energy development |
|
| Environmental issues |
|
| Measures to protect endangered or threatened species |
|
Status of the Recreation and Tourism Sector
To describe the current status and economic significance of the recreation and tourism sector, we rely on existing data sources and interviews with sector experts; we did not conduct a formal survey or collect new information. This section summarizes the data available. It is important to note, however, that in support of MSP in Washington, the Surfrider Foundation and Point 97 are currently conducting a survey of non-extractive recreational use in the study area. The results of this survey are not available at this time, but will provide better information on the nature and economic impacts of the recreation and tourism sector.
Range of Activities
The recreation and tourism activities that occur along Washington’s Pacific coast include both non-extractive activities associated with use or enjoyment of the ocean and extractive activities, such as fishing, crabbing, and clamming. As the table below indicates, the nature of these activities is wide-ranging. Detailed information on participation in recreation activity along the Washington coast is not currently available. A recent study, however, collected data on recreation along the Oregon coast. Despite some important differences (e.g., driving is not generally allowed on Oregon beaches, while it is allowed on Washington’s southern beaches), the results of the Oregon study provide some insight into popular coastal recreational activities in the Pacific Northwest. The Oregon survey indicates that beach going and scenic enjoyment were by far the most popular activities (LaFranchi 2011).
Recreational Activities Along Washington’s Pacific Coast
Coastal tribal event
In a statewide survey of Washington residents conducted in 2012, the outdoor recreation activity with the highest participation rate is walking/hiking/climbing/mountaineering (90 percent of residents participating), followed by other recreational activities (encompassing team and individual sports, fitness activities, swimming, roller and inline skating, and skateboarding), with 83 percent participation. A category identified as nature activities (which includes visiting nature centers, wildlife viewing, gathering/collecting things, and gardening) ranks third among Washington residents, with 81 percent participating. The survey also indicates that eight out of ten Washington residents visited a county, city, state, or federal park in the past year. This includes 58 percent who visited a state park and 38 percent who visited a national park (RCO 2013). Further, the study shows a dramatic increase in participation in many nature-based activities since the last survey in 2002, including increases in fishing for shellfish, visiting a nature interpretive center, and camping in a primitive location (RCO 2013).
Limited information is available to describe where recreational activity within the study area currently takes place. Many activities are likely to be widespread. Several, however, are limited to specific locations. For example, horseback riding and driving on the beach only occur on the southern beaches. In addition, anecdotal evidence indicates that recreational fishing primarily occurs along the southern coast – with roughly 70 percent originating from Westport and Ilwaco/Chinook, and the remaining 30 percent originating from La Push and Neah Bay (Personal comm. M. Cedergreen 2014).
General Recreation and Tourism Data
Several sources provide state level data that are indicative of the economic importance of the recreation and tourism sector. As described below, the most informative of these sources are the National Ocean Economics Program (NOEP); the National Survey of Fishing, Hunting, and Wildlife-Associated Recreation; and an annual analysis of travel impacts prepared by Dean Runyan Associates for the Washington Tourism Alliance.
National Ocean Economics Program (NOEP) Data
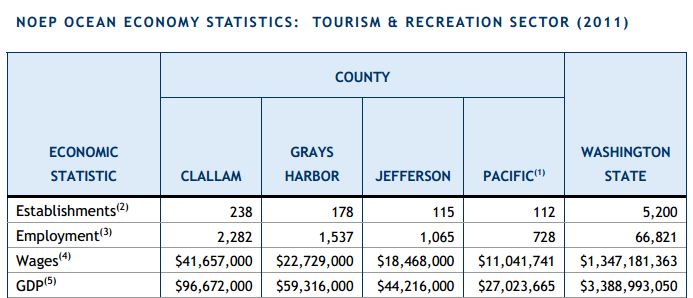
The first data source is the NOEP tourism and recreation sector ocean economy data, available on the Center for the Blue Economy website (NOEP 2014). The ocean economy is defined by NOEP as including all economic activity that derives all or part of its inputs from the ocean (Colgan 2007). As shown in the table below, these data indicates that in 2011, the tourism and recreation sector contributed $3.4 billion (33 percent) to Washington state’s ocean economy. County-level data is also available from this source.
These ocean tourism and recreation data include establishments that are either (1) included in specific industries with activity explicitly tied to the ocean, or (2) located in a shore-adjacent zip code. An important limitation of these data for our purposes is that NOEP treats the Puget Sound and Columbia River mouth as part of the ocean; thus relevant recreation and tourism activity in shoreline-adjacent zip-codes throughout the Puget Sound (including portions of Seattle and Tacoma) is included in state totals. As a result, the four Pacific Ocean counties combined are only a small portion of the state total ocean economy as defined by NOEP which is likely dominated by the heavier economic activity in more developed areas such as Seattle and Tacoma. Specifically, the four counties combined contribute 12 percent of ocean economy establishments and seven percent of ocean economy gross domestic product (GDP) in 2011 based on the data shown in the table below. Combined ocean economy GDP output for the four counties tourism and recreation sector was estimated at approximately $227 million in 2011. In 2011, the most recent year for which NOEP data are available, ocean economy county-level tourism and recreation employment ranged from 728 jobs in Pacific County to over 2,200 jobs in Clallam County. In addition, ocean economy wages from this sector in the four counties totaled nearly $94 million.
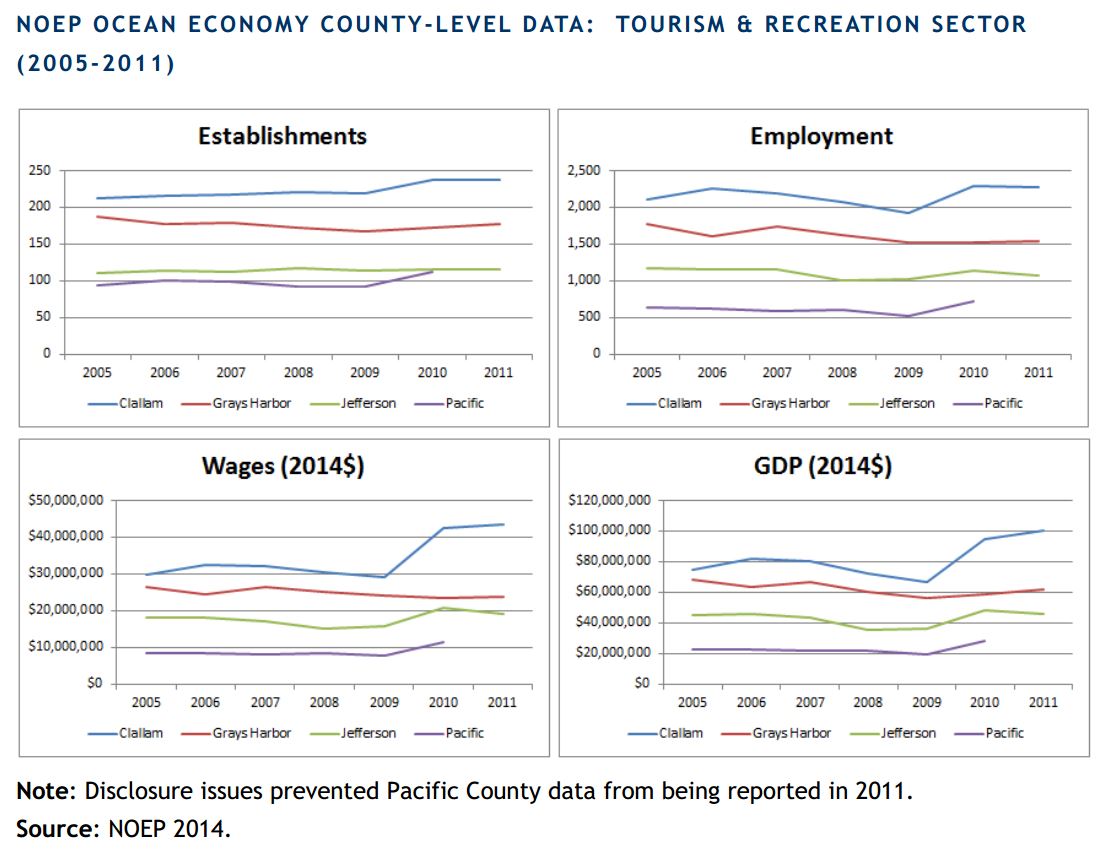
The NOEP data indicate that for the most part, the number of establishments and employment in the tourism and recreation sector in the four counties has been relatively stable from 2005 through 2011, with the exception of 2009 to 2010 when Clallam county employment increased sharply, along with wages and gross domestic product (GDP) in that county. Of the four counties, Clallam County contributes the most to the ocean economy, while Pacific County contributes the least, about one-third as much as Clallam County when measured in terms of GDP contribution to the ocean economy. It is also important to note that the county-level data also overstate results for our study area. For example, Clallam County is home to the most populated city on the Olympic Peninsula — Port Angeles, the headquarters for the Olympic National Park. Similarly, Jefferson County results include recreation and tourism activity occurring Port Townsend, a popular tourist destination at the northeastern tip of the Olympic Peninsula (outside of the study area).
Dean Runyan Travel Impacts and Visitor Volume
For the Washington Tourism Alliance, Dean Runyan Associates prepares an annual analysis of travel impacts. The analysis employs a proprietary regional travel impact model to estimate spending by those traveling to and within the state, as well as the impact of this spending on earnings, employment, and tax revenue. Travel impacts statewide are significant, resulting in nearly $17 billion in direct spending, and contributing more than $1.0 billion in total tax receipts statewide. Exhibit 2-5 provides the most recent county-level data available. These data indicate that of the four counties in the study area, Grays Harbor has the highest travel impact, with respect to visitation, travel spending and related earnings and employment, followed by Clallam County. Direct spending impacts were significant in the four counties, ranging from $116 million to $302 million, while employment generated by travel spending ranged from 1,440 jobs in Jefferson County to nearly 5,790 jobs in Grays Harbor County. Earnings generated by travel spending ranged from $28 million in Jefferson County to $98 million in Grays Harbor County in 2012.
The main limitation of these data is that the county level includes much broader areas than the coast. Further, general travel expenditures may not be representative of visitors participating in recreational and tourism activity deriving from the ocean.

Key Economic Questions and Data Gaps
The economic analysis of the outdoor recreation sector is a challenge. It is a non-standardized sector, for which economic data are rarely collected systematically. The sector generates non-trivial expenditures and provides employment to many people, yet the financial and labor figures are reported as parts of other economic sectors and are often hard to trace. Outdoor recreation activities generate expenditures and employment in manufacturing where equipment and gear are produced, in retail where these goods are sold, in the hospitality sector which provides lodging and dining, and in numerous other industries. Specific employment data for outdoor recreation as an industry does not exist (i.e., through the Bureau of Labor Statistics Quarterly Census of Employment and Wages).
As noted above, there are limited recreation and tourism data for Washington’s Pacific coast. In addition, for many of the available sources, data are only available for activity occurring at the state or county level, which will overstate economic impacts resulting from activity within the study area. In other cases, while we may have data on visitation for an area (i.e., state parks), we do not have related expenditure estimates. This is far from the data that, ideally, would be available to estimate economic impacts resulting from ocean-derived recreation and tourism activity (i.e., data on the number of visits to the area of interest, coupled with information on spending associated with such trips).
As noted previously, the Surfrider Foundation and Point 97 have recently launched a survey to document the recreational use of Washington’s coast. The survey will collect information on the location and type of public recreation occurring from Ilwaco to Port Angeles and provide estimates of the value of that recreation to the state’s economy. This survey will provide new data to answer questions about the level of recreational activity and economic impacts stemming from that activity within the study area (and somewhat beyond, as the survey will cover an area along the Strait of Juan de Fuca).
With respect to the economic data that would be most useful for understanding the importance of recreation and tourism to local and regional areas, there are several important data gaps to note:
- Data illustrating the level of participation in specific activities along the coast are largely unavailable – thus, it is not possible at this time to compare the contribution of different activities to the regional economy.
- The Surfrider survey currently being conducted will not include data on extractive recreational activity, such as fishing. While information is available on the level of participation in this activity, local spending data for recreational anglers are not readily available.
- Recent expenditure data for visitors to state park or ONP locations in our study area are not available.
Further research may enable us to identify additional data on certain activities within the study area. For example, additional data from Indian Tribes and for whale watching activities within the area are likely to be available, as may be additional information on visitation to Grays Harbor NWR.
Recreation and Tourism Specific Information
For specific information about fisheries including recreation sites by county, recreational boating information, economic impacts of parks and wildlife refuges, tourism on tribal lands, and existing laws, read the full Sector Analysis Report on Recreation and Tourism.
Back to Top